Features
Layer-based Visualisation
The basic visualisation concept of NinJo is the presentation of data in separate layers. Users can add as many layers to a NinJo scene as they want (restricted only by memory amount of hardware). All layers show time-synchronised data for the same map area in the so-called NinJo scenes.
The layers are independent and can be added and removed from the scenes separately. If they are added to a scene, they can be set visible or invisible. Furthermore, their transparency is continuously adjustable.
Layers can be arranged in any order the users want enabling them to arrange all data types according to their specific needs.
Amongst others, NinJo visualizes the following data:
- Surface observations and station based forecasts,
- NWP (Numerical Weather Prediction) fields,
- Satellite data and derived synthetic products ,
- Radar data and derived products,
- Aviation reports and forecasts,
- Sounding data,
- SatSounding data,
- SatWind data,
- Automatic satellite image interpretion data,
- SCIT (Storm Cell Identification and Tracking) data,
- Lightning data,
- Road weather observations and forecasts,
- MOS (Model Output Statistics) data,
- Ocean profile data,
- Warnings based on the monitoring of incoming data,
- Trajectories,
- Webcams and
- Geographical information (based on vector and raster data).
Furthermore, NinJo contains the following components:
- Product Workbench to produce synoptic charts, e.g., the Significant Weather Chart SWC, as well as
- NinJo Batch to generate products automatically.
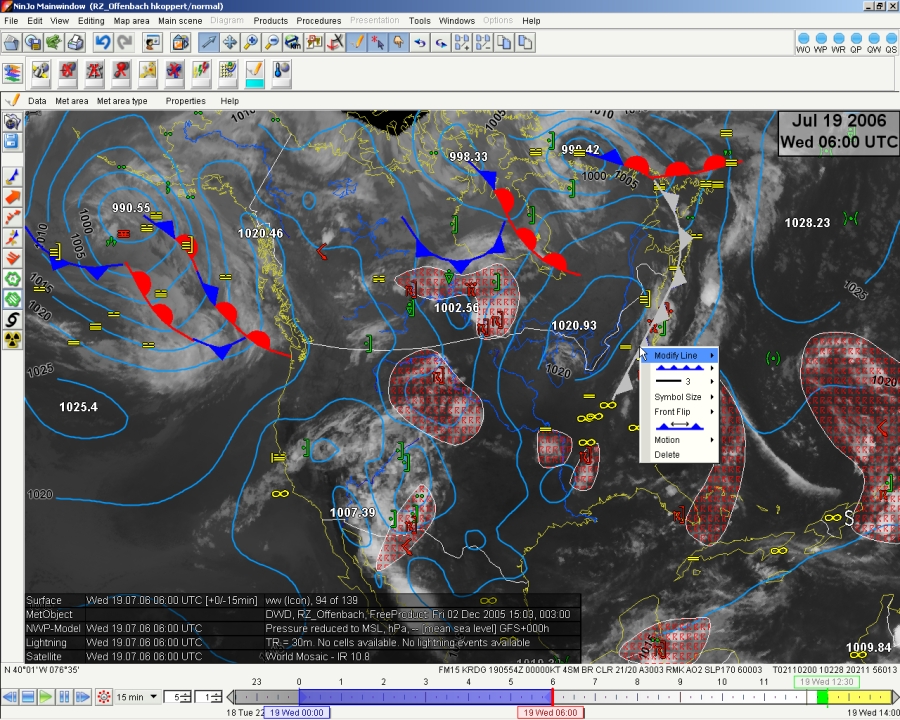
Animations
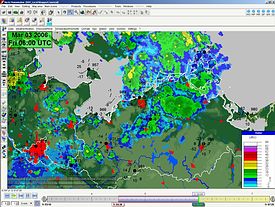
- Combined Map of radar and surface data. Each map scene can be run in an animation loop.

Where necessary, map displays (e.g. radar or satellite images) can be played back as an animation over certain time domains. This allows the evolution of both past events and predictions to be visualised.
The animation feature is available for all layers and all zoom levels. Each of the scenes (max. one main and three secondary scenes) can be animated individually. The time range, interval, and animation speed is set by the user (see Figure 7).
Auto updating of all data is also supported while running an animation. NinJo currently checks once a minute for new data and updates the necessary animation frames.
NinJo Applications
The superiority of NinJo is evident especially in the modular principle of construction comprising different layers and applications that are available to the user. In one and the same window, it is possible to open several scenes with different areas of work. All visualisations are not generated until the instant of querying and, as a result, are always right up-to-date. Data comes directly from the servers.
Besides the main window, further secondary windows can be opened. The entire set of windows and scenes comprises the work session, which is stored as a configuration and called up with the same layout the next time the program is started.
No matter whether your work involves station data, satellite images, weather maps, warning messages, radio soundings, meteograms etc.: NinJo has not only extensive forms of representation but also, in its Enterprise edition, offers experienced software developers the option of producing their own layers and applications.
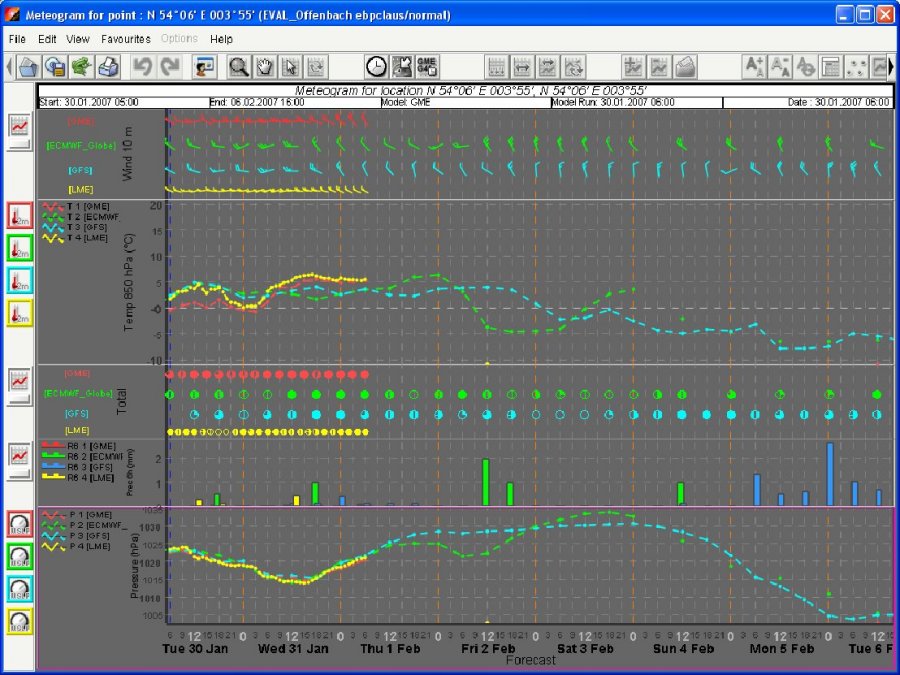
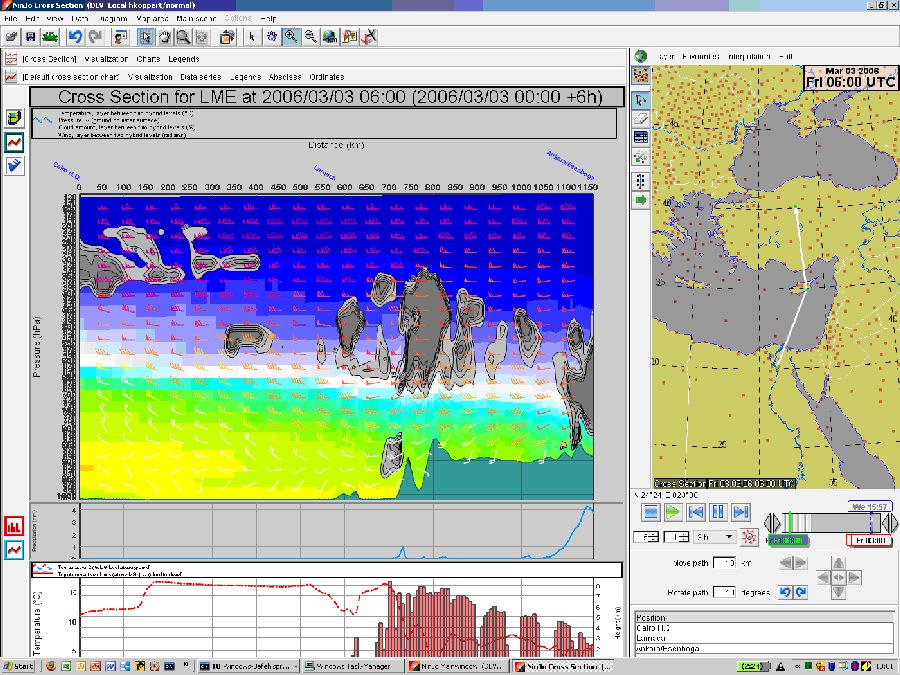
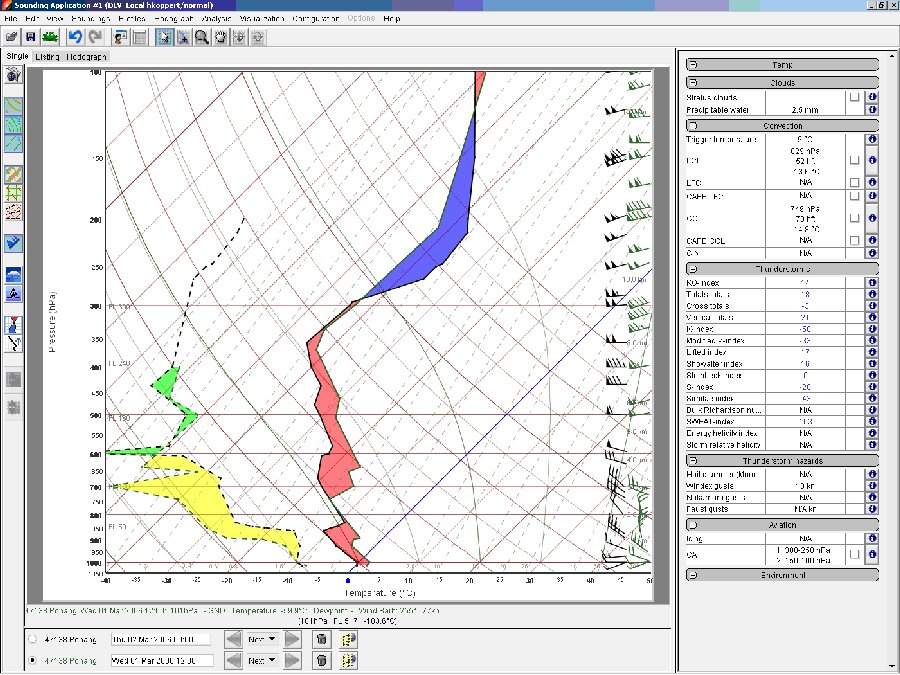
Meteograms, Cross-Sections, Soundings

- [1]

- [2]

- [3]

- [4]
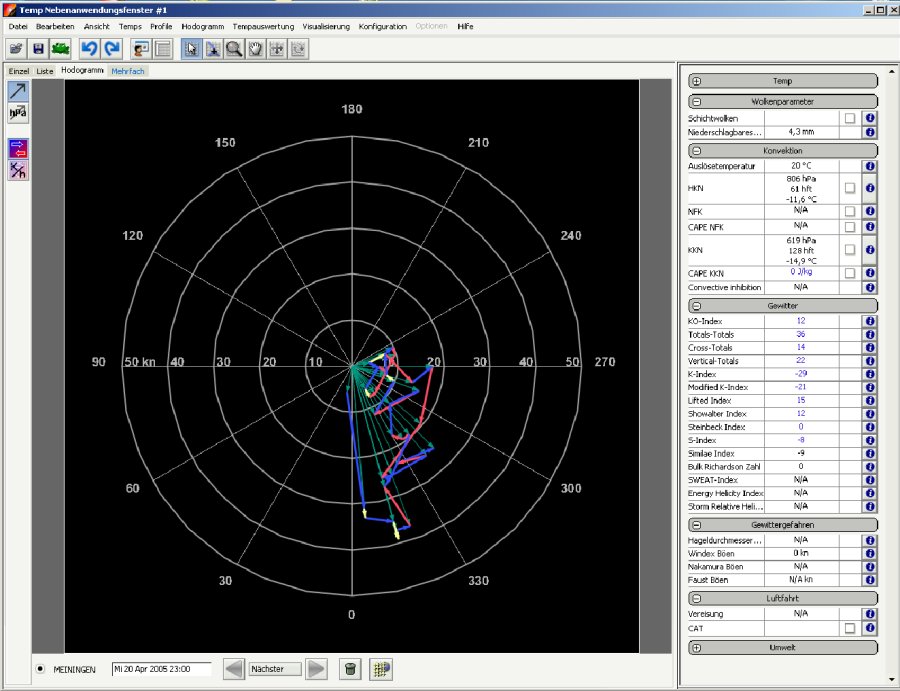
NinJo supports the creation of meteograms and soundings for specific station data or model data. Different models (meteograms) or stations (soundings) can be compared with each other. Also, the creation of vertical cross-sections is possible.
Graphical Editor

- Activated layer and editing mode to easily draw meteorological objects for analysis
The graphical editor allows the user to create weather maps. Standard functions include, for example, drawing-in or alteration of fronts, jet streams, severe areas as well as marking of storm cells and the like. It also allows the meteorologist's experience and knowledge to be directly brought to bear on the weather map. On screen drawing is supported by connecting an interactive pen display.
Configuration
The NinJo main window with one so-called main and up to three separate secondary scenes is just the framework around various areas. Each scene can comprise a variable number of layers which are arranged in the layer bar. All user specific configuration parameters such as selection of layers and scenes, time slots, arrangement of windows etc. are stored on the server. At next login the user will start with the same configuration even if he resumes the work at another client computer.
Most of the system configuration can be done interactively. The configuration of XML files can be adjusted by the customers themselves, if necessary. Depending on the configuration, NinJo may be started either with one or more display screens, or with one or more windows and layers. Its design resembles the building-block principle.
NinJo is open for further layers and applications. Customer-specific extensions or alterations can be implemented according to requirements.
Some Examples

- [1]
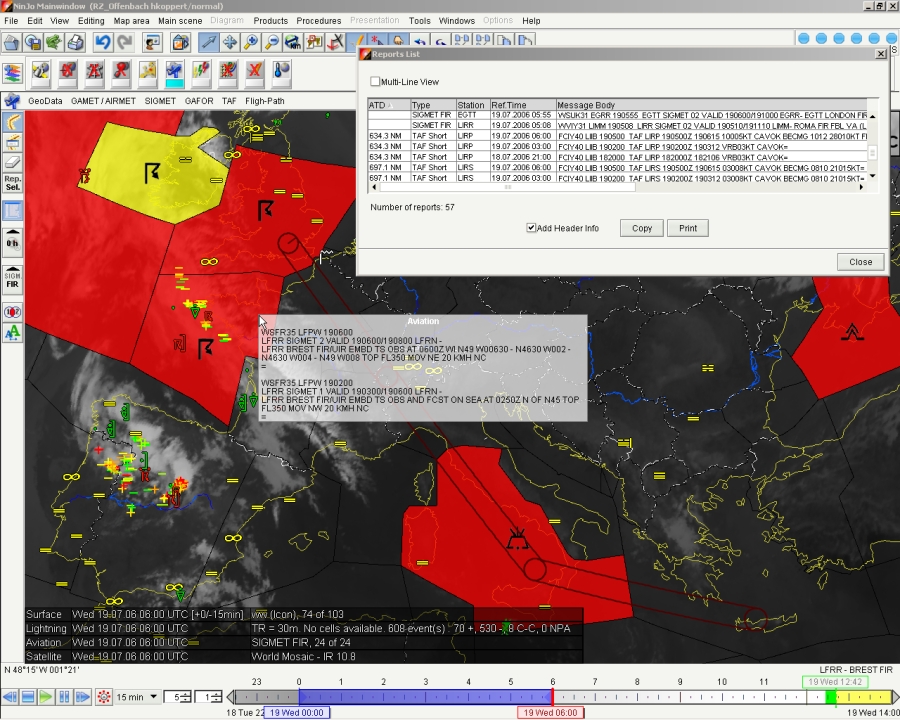

- [2]


- [3]
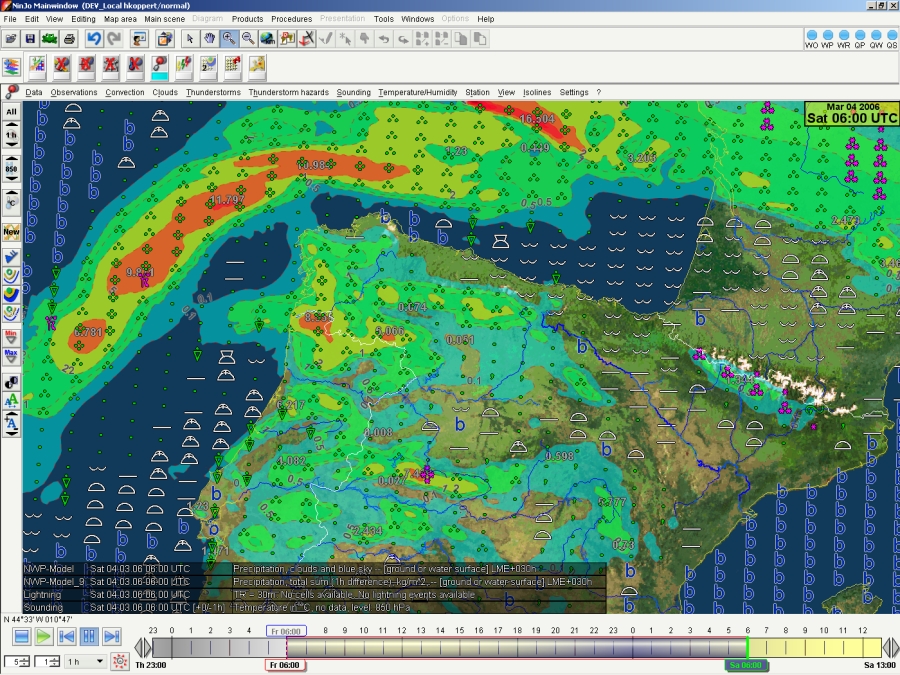

- [4]

- In the aviation layer the relevant SIGMETs and TAFs are displayed along the flight path.
- Model outputs can be displayed either as cross-sections or in the form of maps.
- Several upper-air soundings can be displayed together in a differential plot.